ML Jargon Glossary Pt. 1
My list of ML Jargon that I forget too often than I probably should...
Preface
At the moment, I learn best when I'm reading and have a writing utensil at hand. I underline/highlight/box stuff I don't understand, and often ask the question: "What is ___?"
The margins of my reading material are filled with these questions, and what's annoying and even discouraging is a margin filled with a huge list containing "What is this?"s and "What does this mean?"s.
I'm currently working through a book called Build a Large Language Model From Scratch by Sebastian Raschka, as I'm trying to rebuild the foundations to break back into the NLP field, and I'm noticing that I get tripped up by a handful of jargon whenever I read a paragraph.
I attribute this to my dear arrogance, who rightfully thought she could just "dive right back in." So the conscious and realistic me had to give her a wakeup call to throw her ego out the door.
Anyway, back to the point.
This is a non-exhaustive list of jargon that I ran into -- and you may too -- while rebuilding my ML foundations. I might have a part 2 (or 3 or 4) depending on how long the list is, but as far as this post goes, I'll focus on the terms I ran into while reading about implementing a typical training loop in PyTorch.
Hope this helps,
Ael
Logits
The numerical outputs from a neural network's final linear layer, before converting them into probabilitites
The Simple Version
Logits are the raw numerical scores that neural networks output when making predictions. They are essentially just real numbers that range from -∞ to ∞.
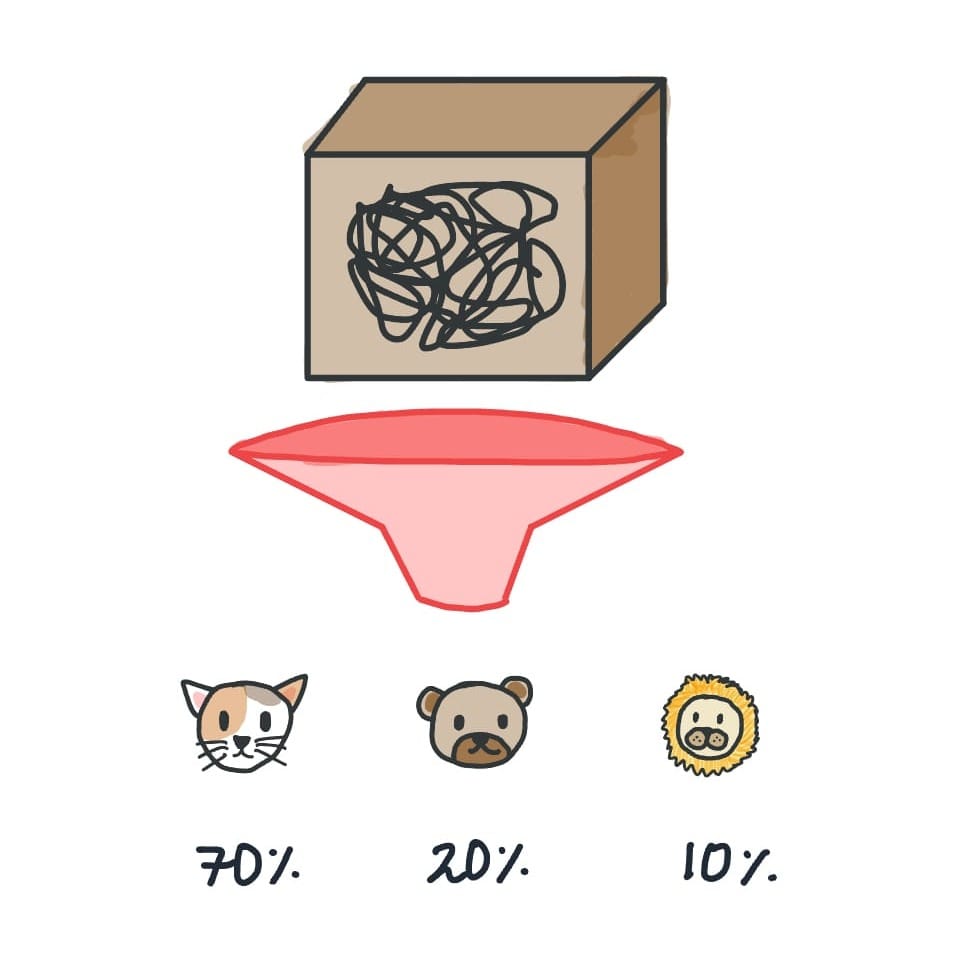
For example, if you're building a classifier that classifies an image as a cat, bear, or a lion, the network might output:
- Cat: 2.5
- Bear: -0.3
- Lion: 1.2
These numbers (2.5, -0.3, and 1.2) are the logits.
Looking at these scores, you may ask: "How do you know from those scores whether the model predicted a cat, bear, or a lion?"
...And that's exactly why we have functions like softmax or sigmoid, which squashes the logits from range (-∞, ∞) (or the Real Numbers) to the range [0, 1] (probabilities). I'll have a whole section on these two functions, so scroll down if you're curious.
Some Etymology For Those Who Are Curious
Exercise your free will and skip over this section if you want 😃
The name comes from the mathematical concept of "log-odds."
When you get probabilities by applying softmax to logits (again, more on this below), then take the logarithm of those probabilities, you return to your original logits. In other words, logits are the logarithm of the odds.
A Quick Primer on Odds VS. Probability
If you're already familiar with the difference between odds and probability, feel free to skip over this introductory section.
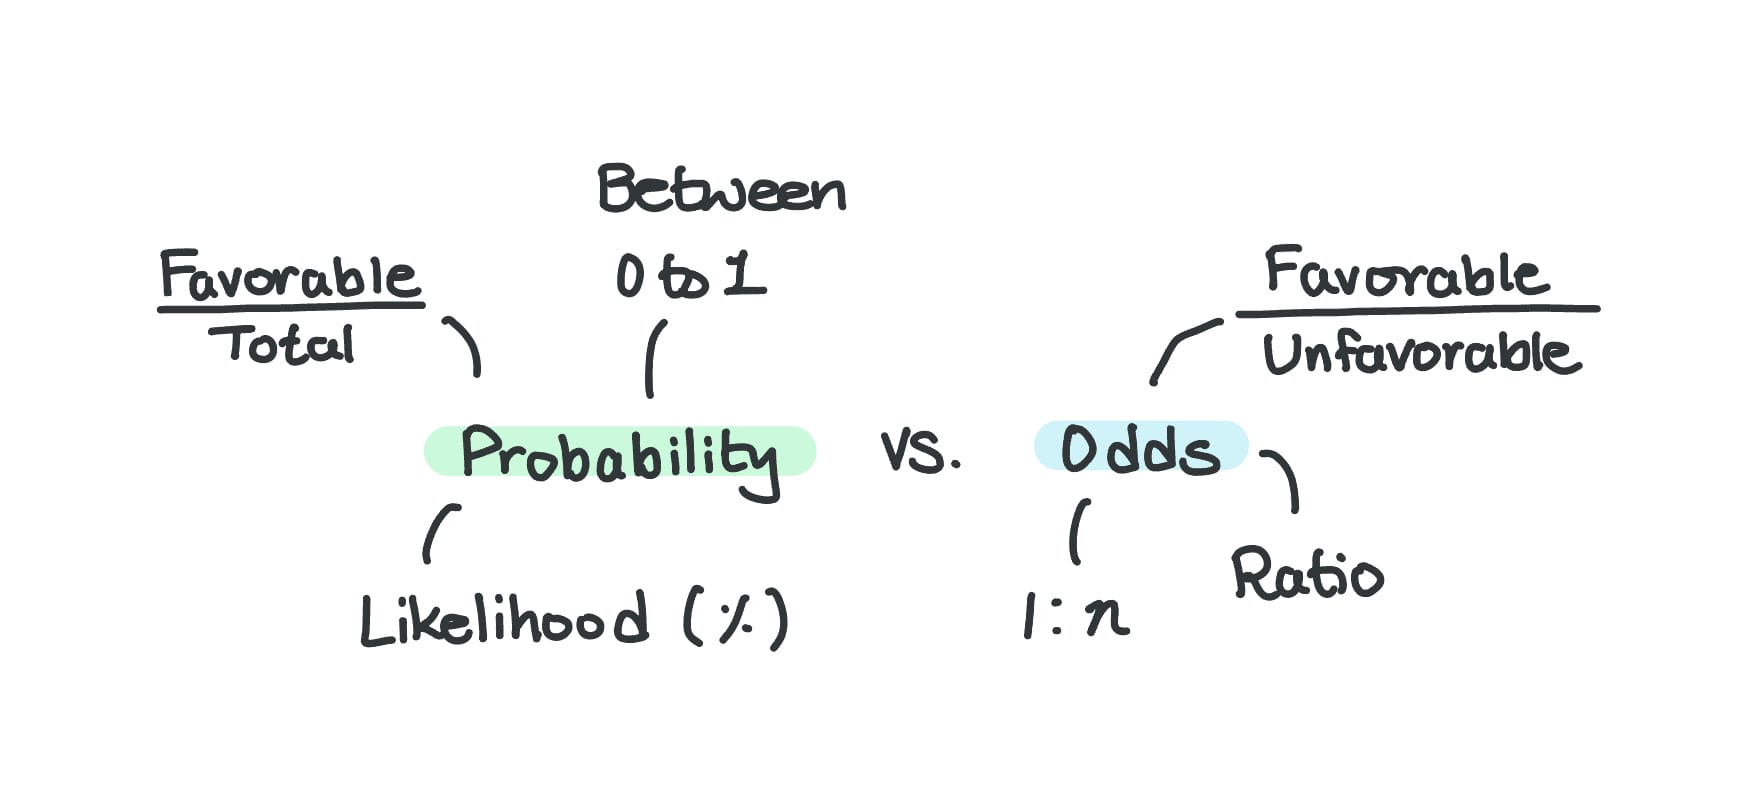
This is a concept that's used interchangeably with probability, and while they are related, they're not the same.
Here are two questions to get started:
What is the probability of getting a 6 when you throw a 6-sided die? 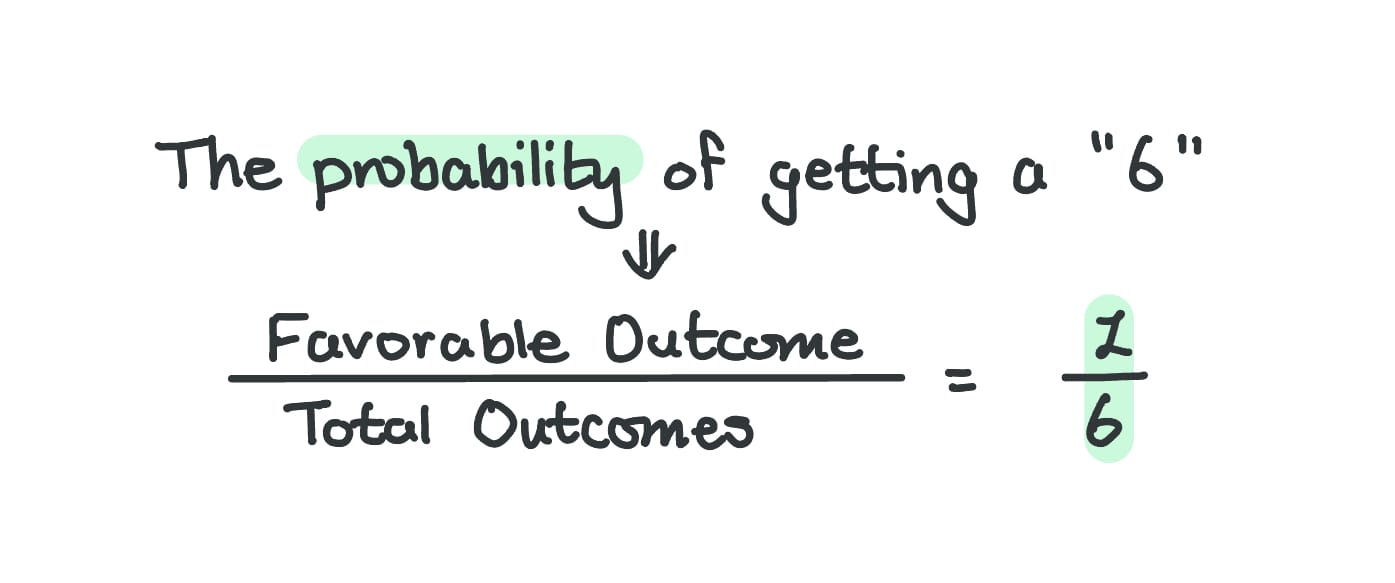
What are the odds of getting a 6 when you throw a 6-sided die?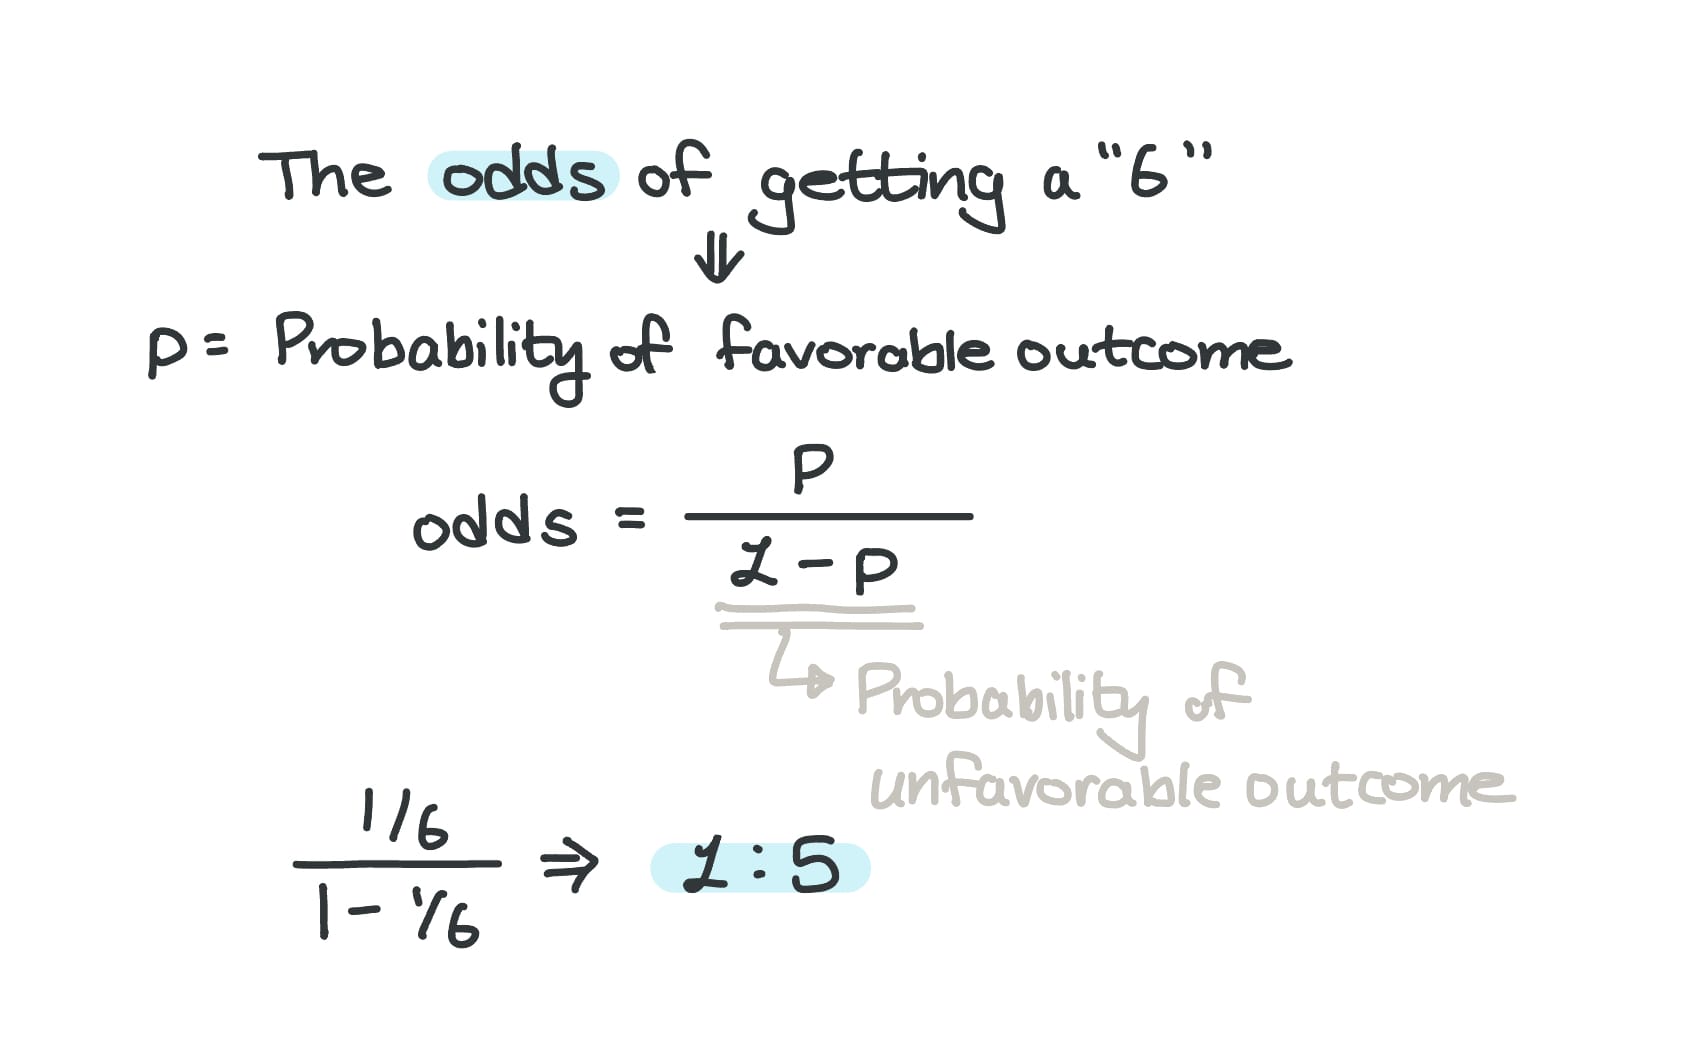
The Logit Function
Now, in math, there's a logit function that converts probabilities to log-odds:
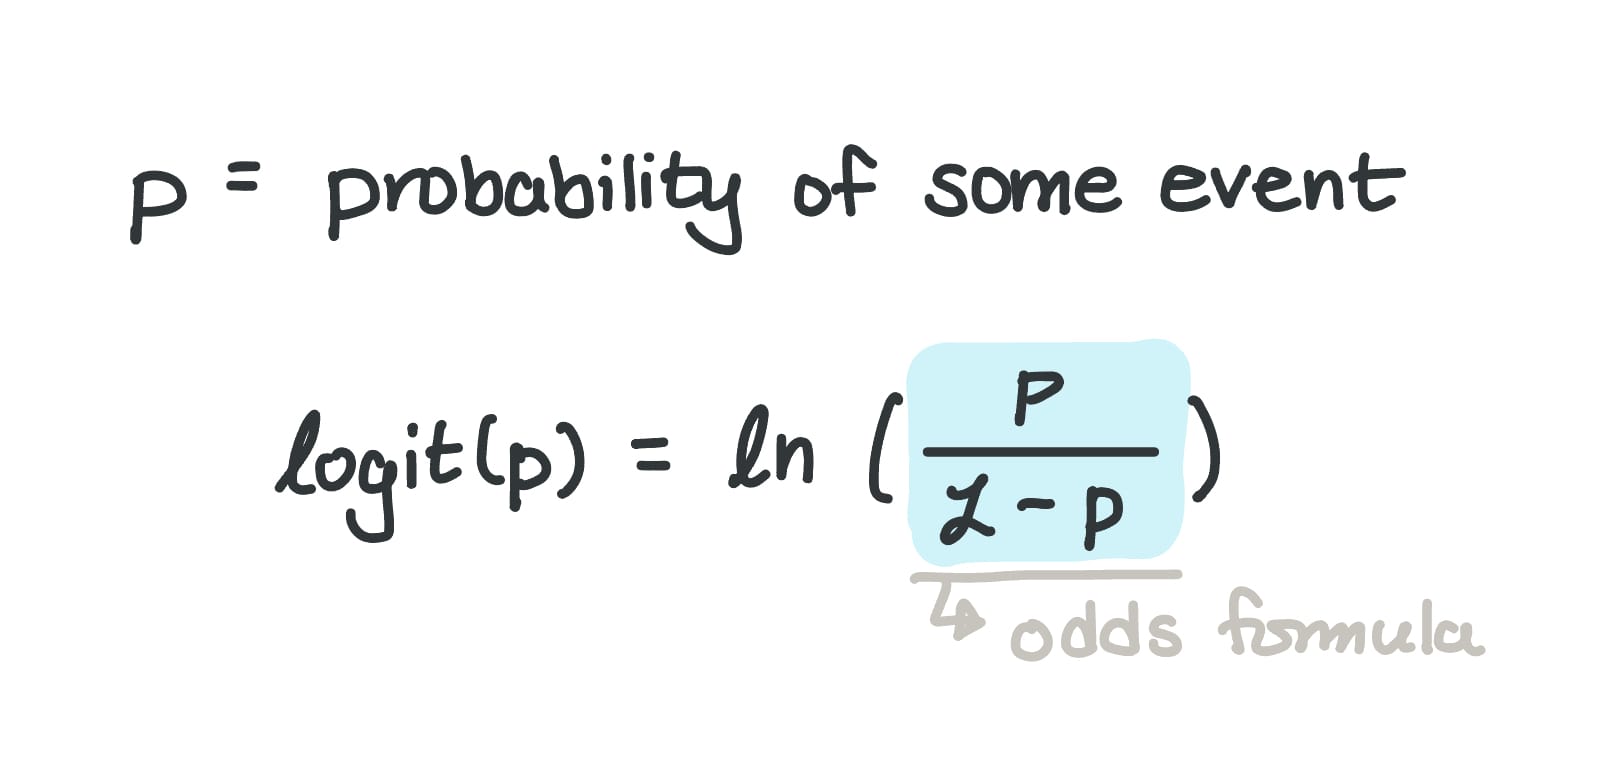
This function takes probabilities (range [0, 1]) and "projects" them out to the set of real numbers (range (-∞, ∞)). Here's a graphical representation:
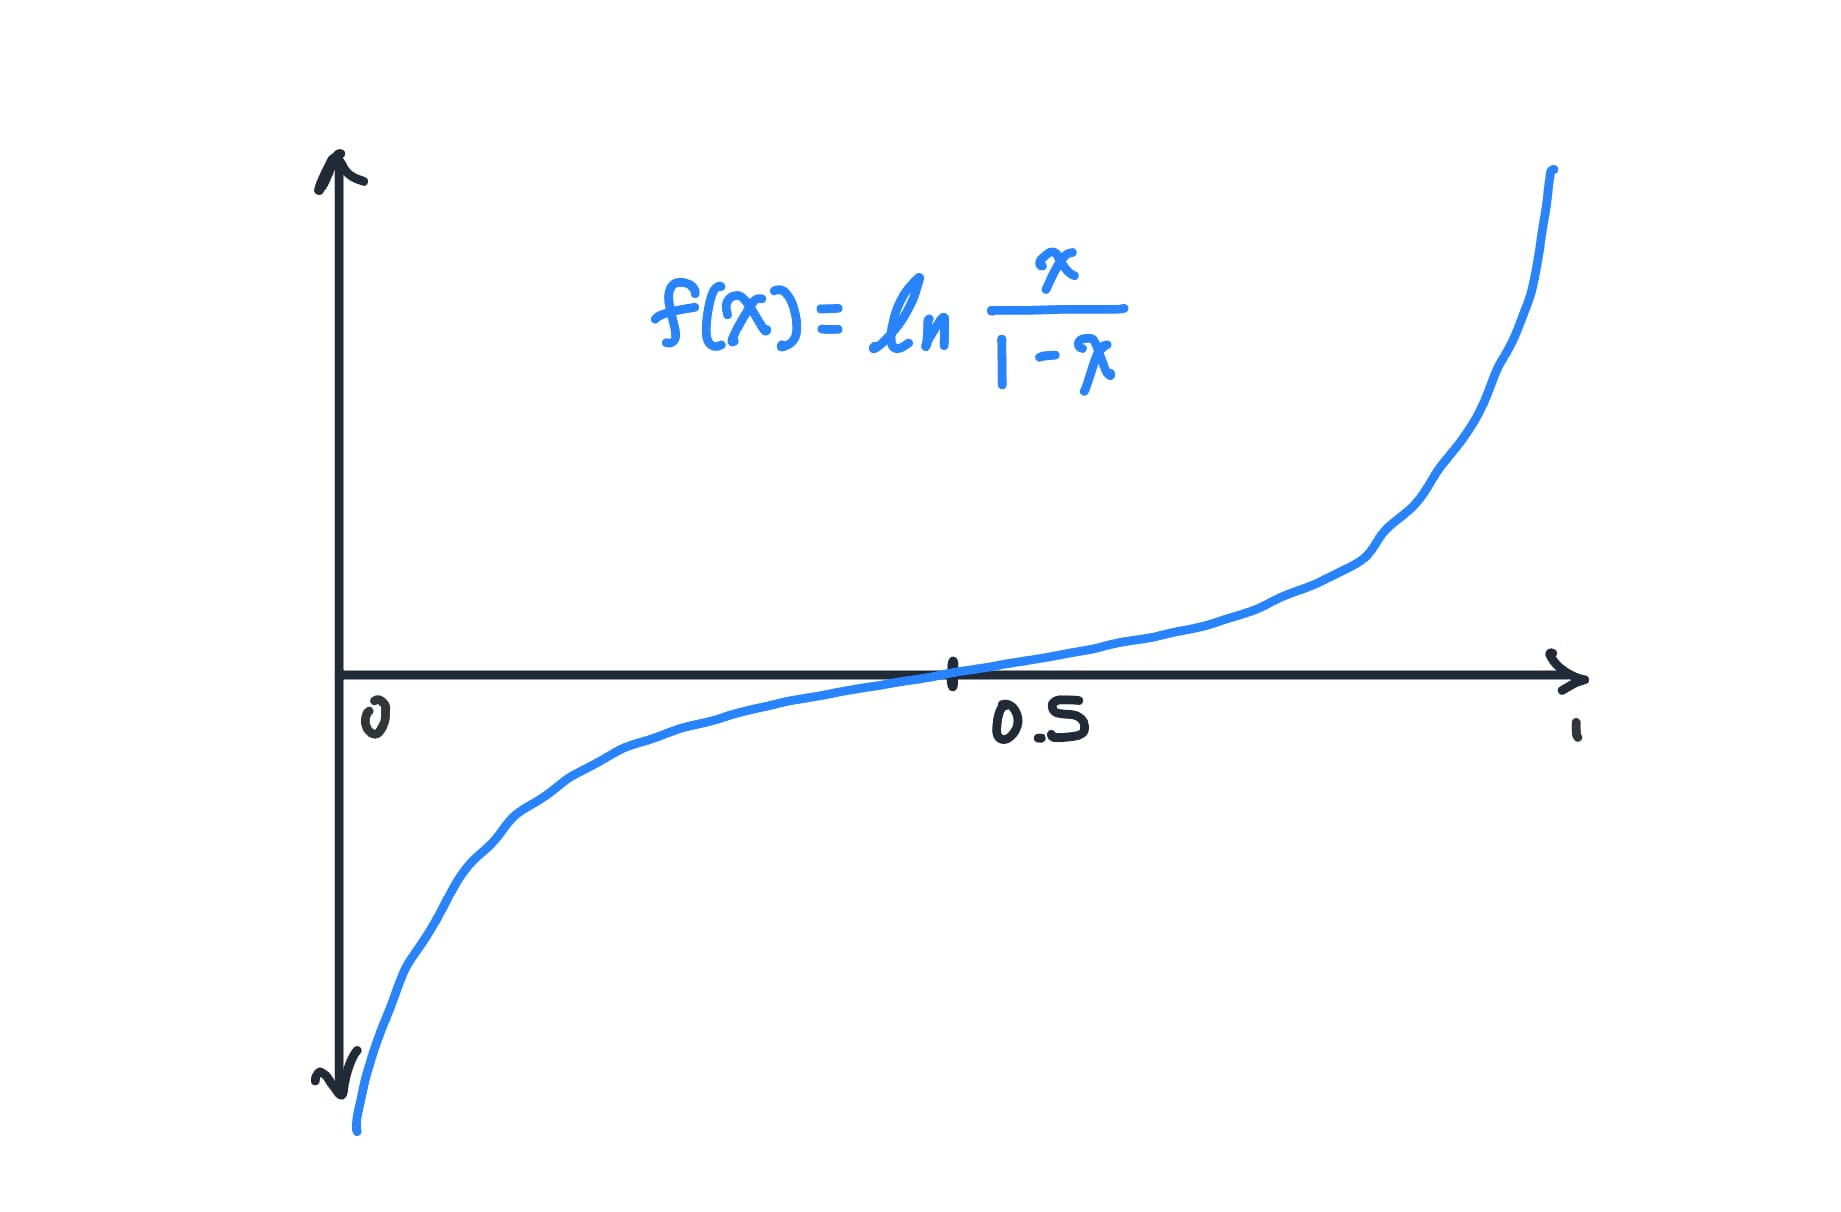
I like to think that neural networks borrowed this term because their raw outputs (the logits) have the same property – they can be any real number and represent log-odds of the predicted probabilities. But importantly, we don't actually use the logit function directly in neural networks; we just call the raw outputs "logits" because of this parallel.
Softmax & Sigmoid
These functions are two examples of non-linear activation functions, which deserve a post or posts of their own. As far as this post goes, I'll focus on defining softmax and sigmoid.
Softmax
A math function that takes in a list of raw numbers (in this context, logits) and converts them into probabilities – usually used for multi-class classification (number of classes > 2)
Sigmoid
A math function that takes a real number and converts it into a probability – usually used for binary classification (number of classes = 2)
If that doesn't cut it for you, here's some math 😅:
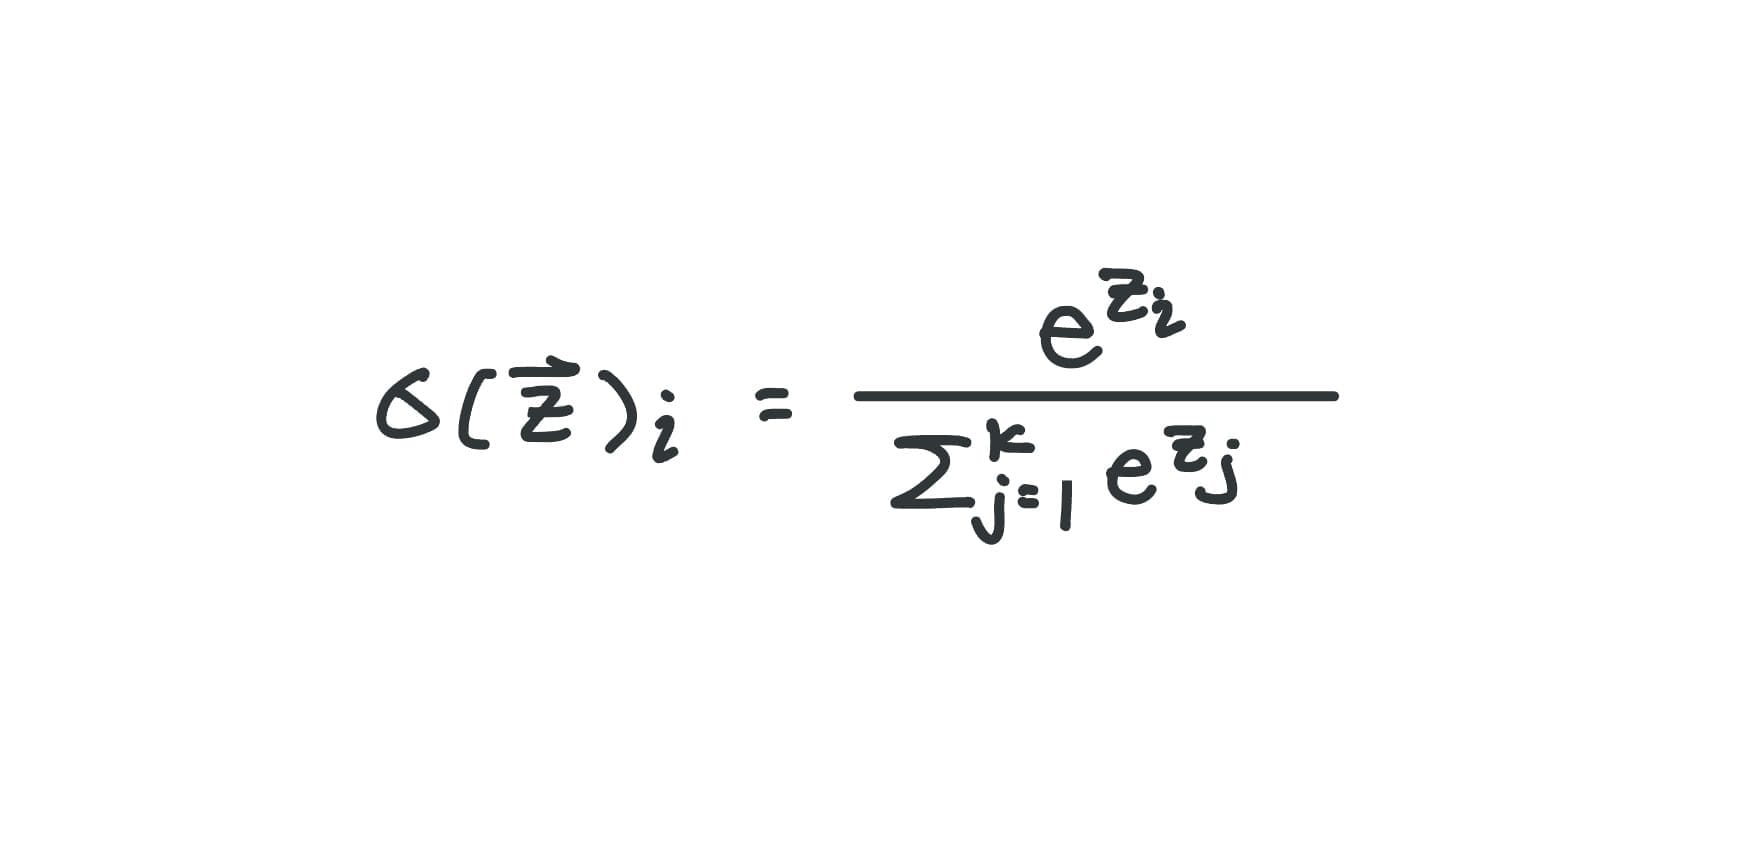
I'll start with Softmax, since it's essentially a more generic form of the Sigmoid function.
Our friends at PyTorch did us a great favor and saved us from having to do a bunch of exponential calculations. In code, the function is pretty simple:
import torch
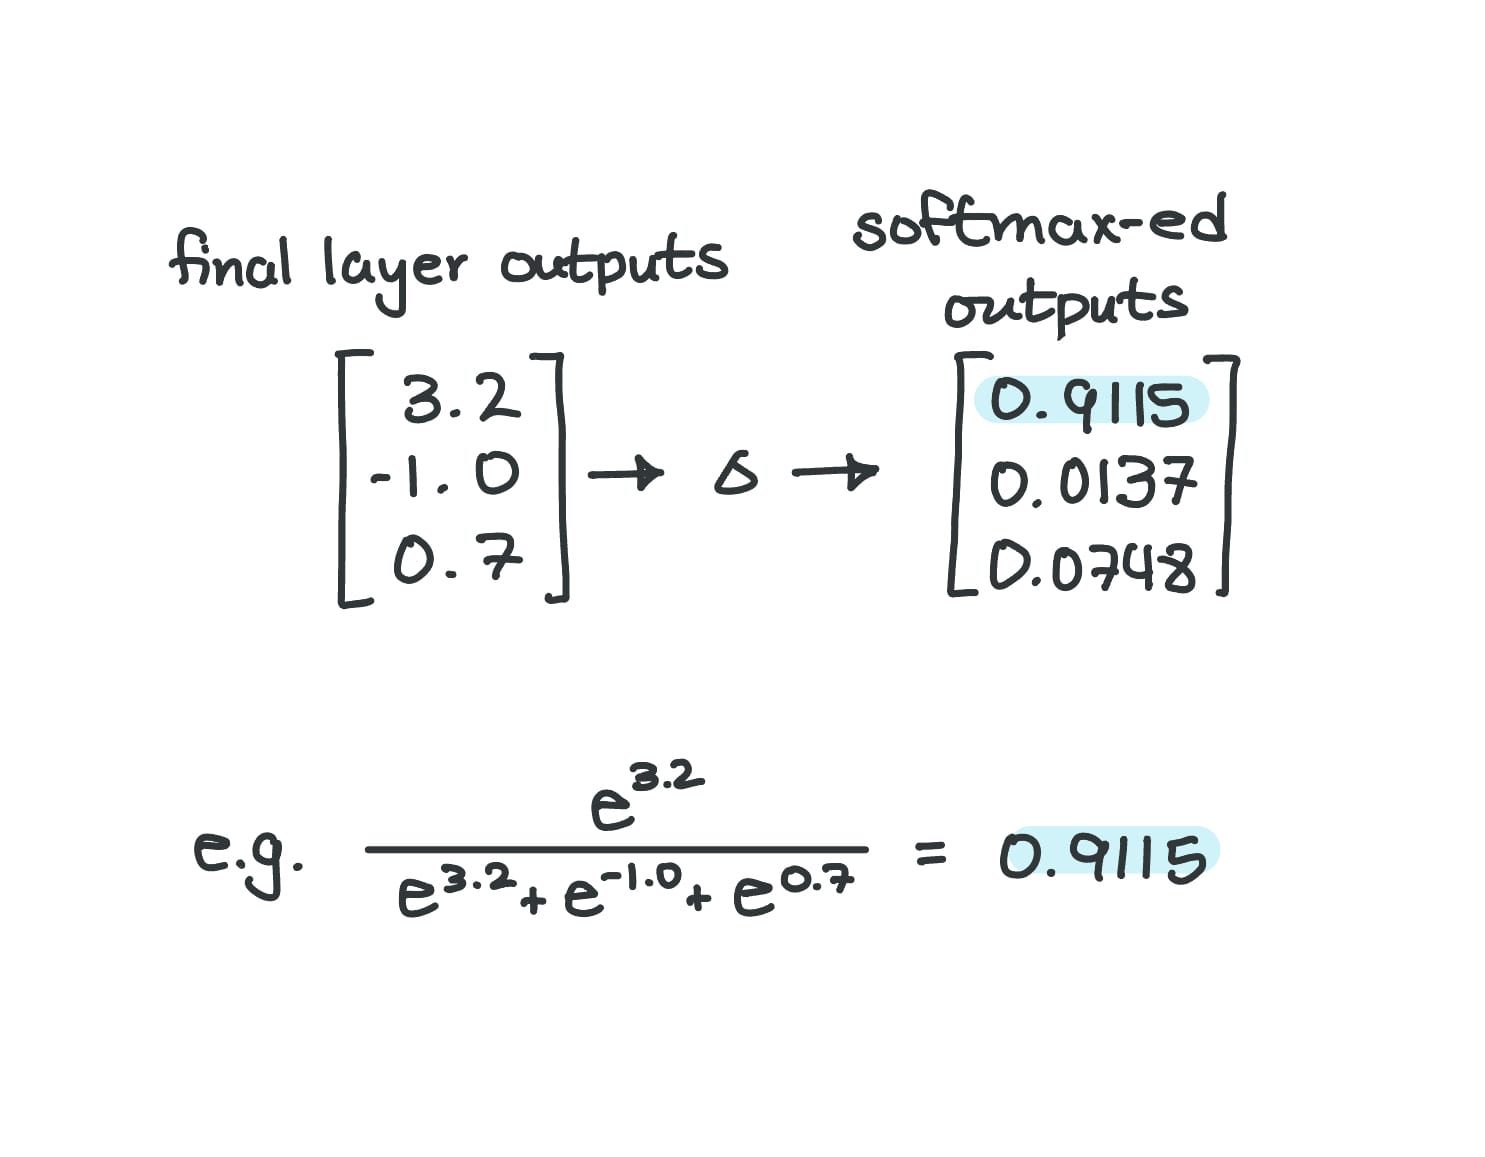
a = torch.tensor([3.2, -1.0, 0.7])
torch.nn.functional.softmax(a, dim=0)Same list of numbers going through softmax
And the result:
tensor([0.9115, 0.0137, 0.0748])...but of course, me being me, I had to prove it out myself:
If you look at the input to the Softmax equation, you may have noticed that it is a list of numbers. I like to connect this observation to the common practice of using Softmax for multi-class classification (e.g., taking handwritten digits and classifying them 0 through 9).
Speaking of the number of outputs, I like to think of Sigmoid as a "special" version of Softmax, where we only have 2 classes – a.k.a. binary classification.
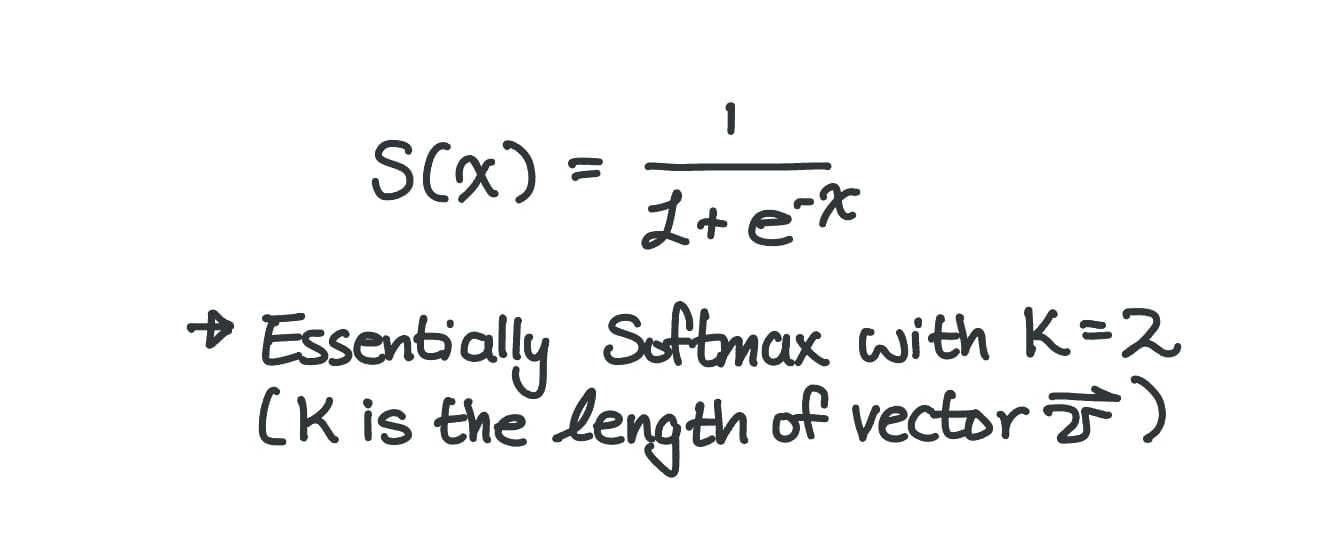
Here's what it looks like:
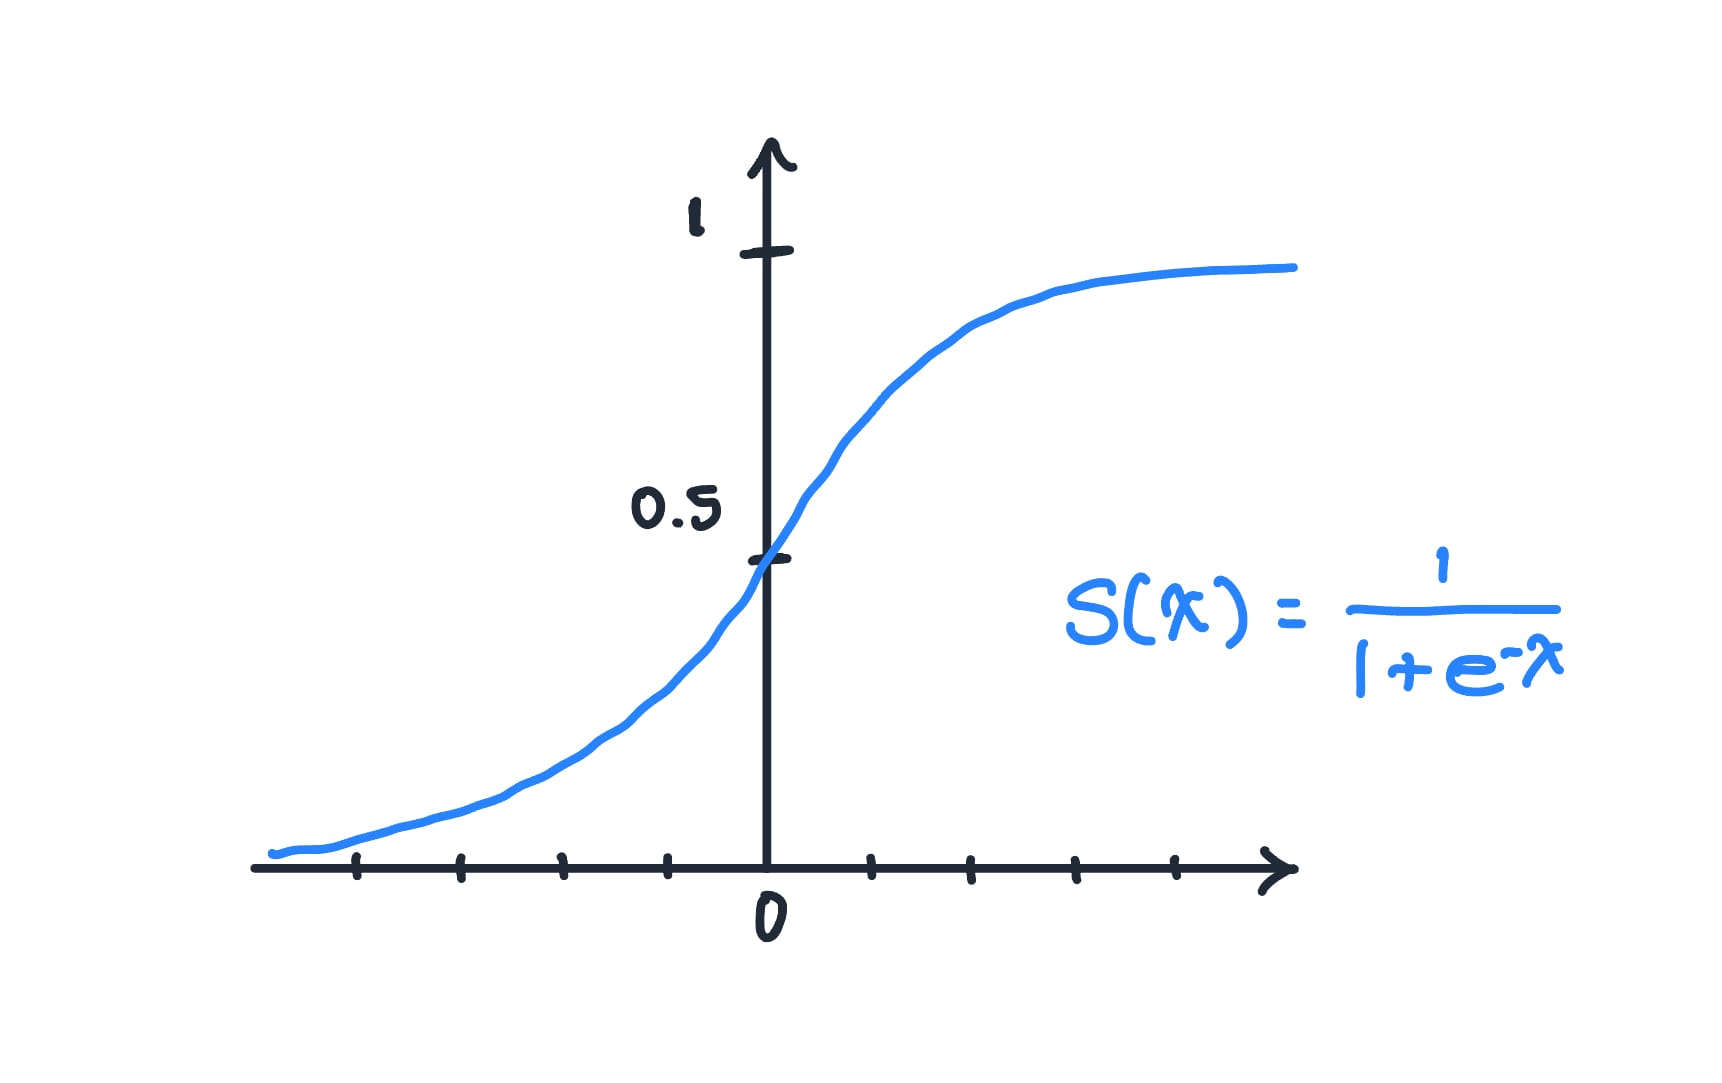
As I mentioned, you can think of Sigmoid as a version of Softmax with the input being a list of 2 numbers (2 raw scores). Since a binary classification is a simple yes/no decision, you essentially only need one probability. For example, if the probability of an email being spam is 0.8, then the probability of it being non-spam is 1 - 0.8 = 0.2.
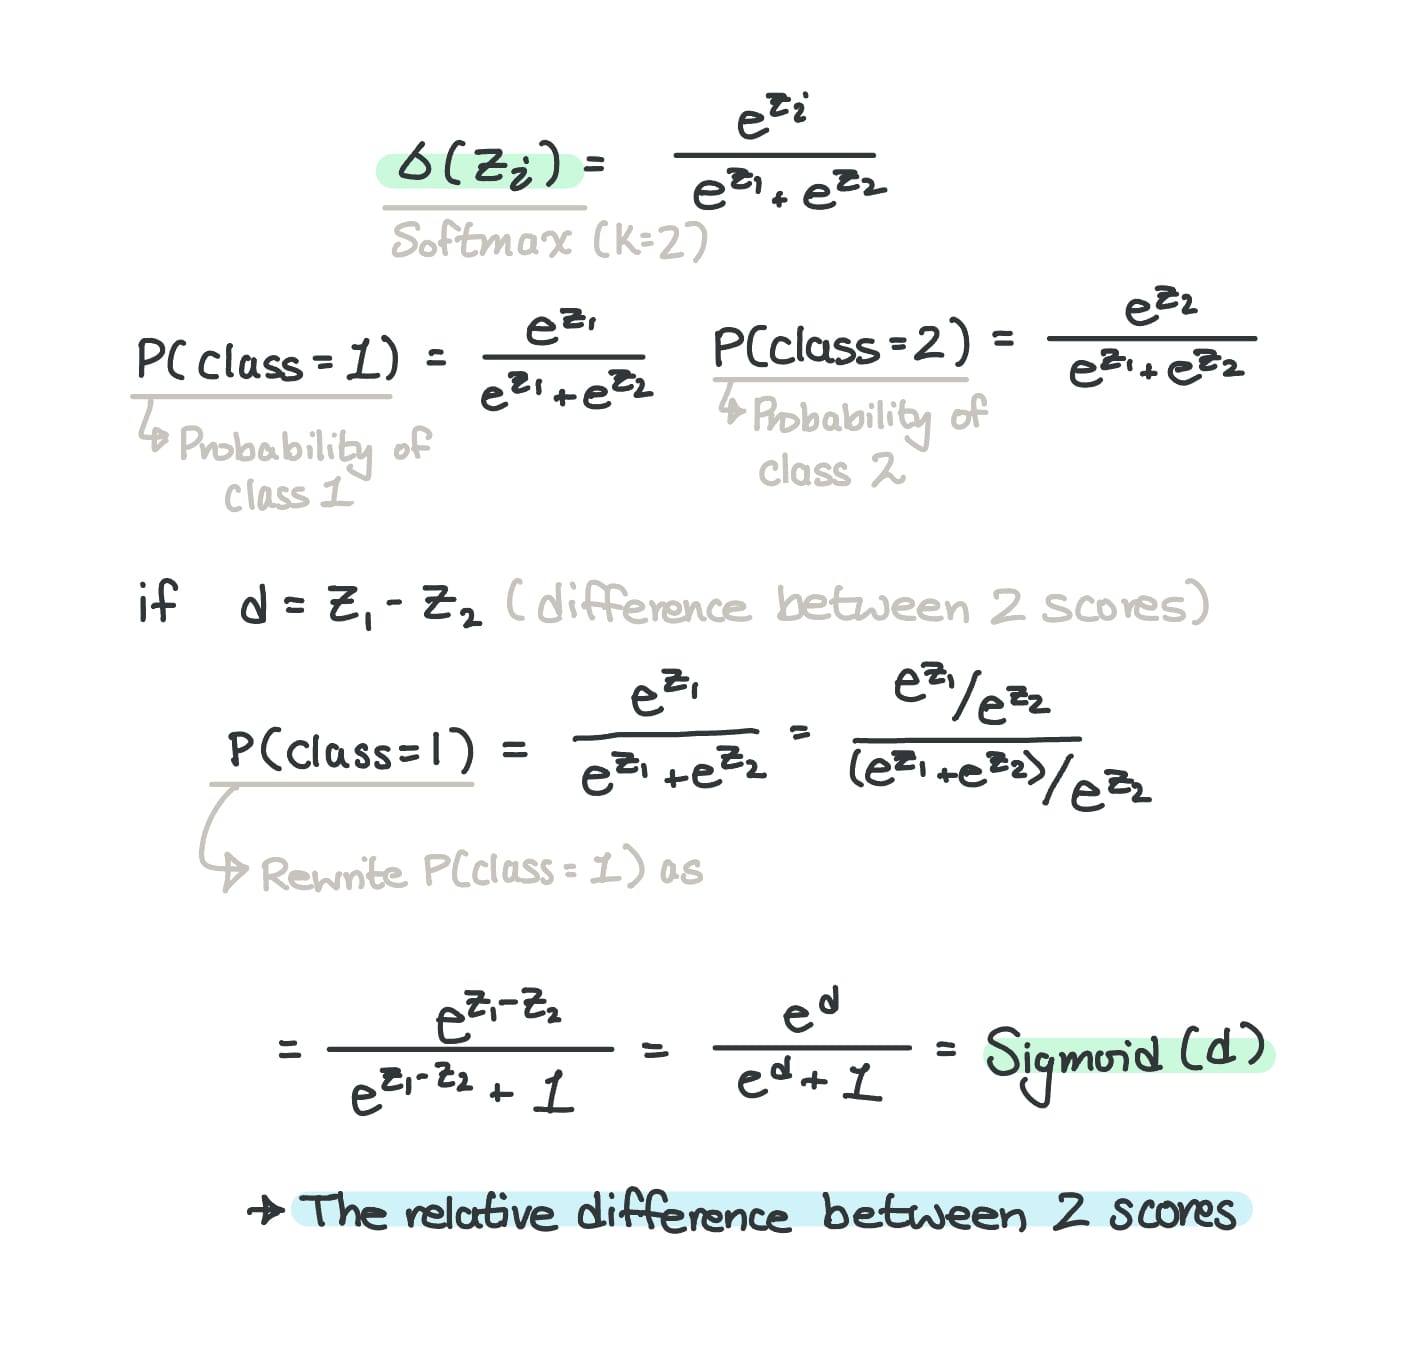
Since Softmax with 2 outputs simply calculates the relative difference between the two scores, it would be redundant to calculate the softmax for each element if you only had 2 scores: the probability of the second class is just 1 minus the probability of the first. Therefore, it's more efficient to use Sigmoid when working with binary classification.
Loss
The discrepency between the neural network's predications and the actual labels
As much as I hate being wrong or making mistakes, it will always happen, and despite the pain, getting the wrongness corrected is the moment when I learn & grow the most.
Now I'm not here to give neural networks a persona, but the same goes for them. If they produce some prediction, you have to give it feedback on whether or not they were wrong (in the case of classifiers) and how much they were wrong by – i.e., the extent of their "wrongness."
The loss is a value that tells how wrong a model's prediction is, and depending on the type of task you're working with (i.e., regression or classification), the way of measuring the loss differs. Nonetheless, the general idea here is that the loss value ultimately contributes to making models "better." This too deserves a post of its own IMO.
Cross Entropy
Cross-entropy is a type of "loss," usually used for classification tasks.
A value that represents how different two probability distributions are: the predicted probabilities from the model vs. the true answers.
(Or, how "surprised" the model is when it compares its outcomes with the true labels)
When I came across this term after my ML hiatus, the question that immediately hit me was:
What's so "crossed" (cross) about how chaotic something is (entropy)?
As someone who was pretty passionate about physics at one point in my life, I couldn't get out of the way I framed entropy as how chaotic, or disordered, the particles of a system were. However, I wouldn't say entropy in the ML context is too far off. It's more about how "surprised" a model would be after it compares its predictions to the true labels. Here, the intuition of “more disorder = more uncertainty” carries over.
Example (skip if not needed)
Let's say we're dealing with an image classification model, where, given an image, the model predicts whether the image is a cat, bear, or lion.
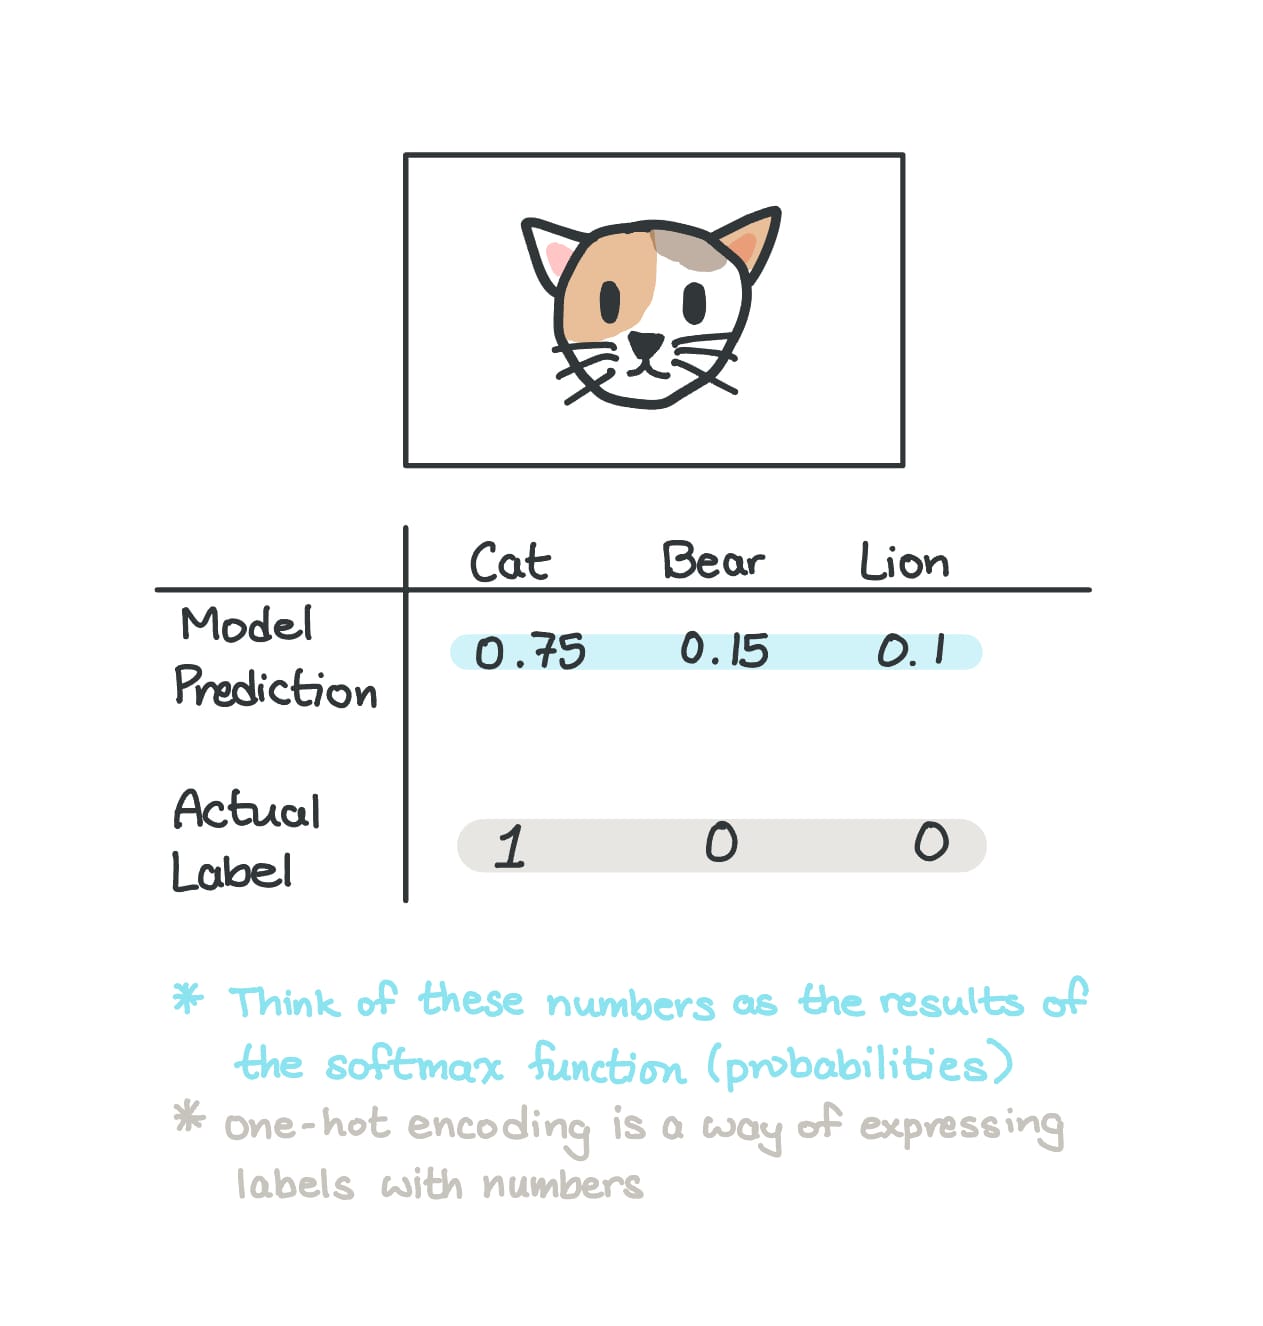
As you may have noticed, the model's prediction is looking pretty accurate: it assigns a 0.75 probability that the image is of a cat, and the true label confirms that the image is indeed a cat.
So, in terms of how "surprised" the model is, it shouldn't be too surprised, given that it predicted a higher chance of the image being a cat. You can think of the numerical extent of "surprise" as the cross-entropy value.
Speaking of surprises, cross-entropy also has a mathematical equation:
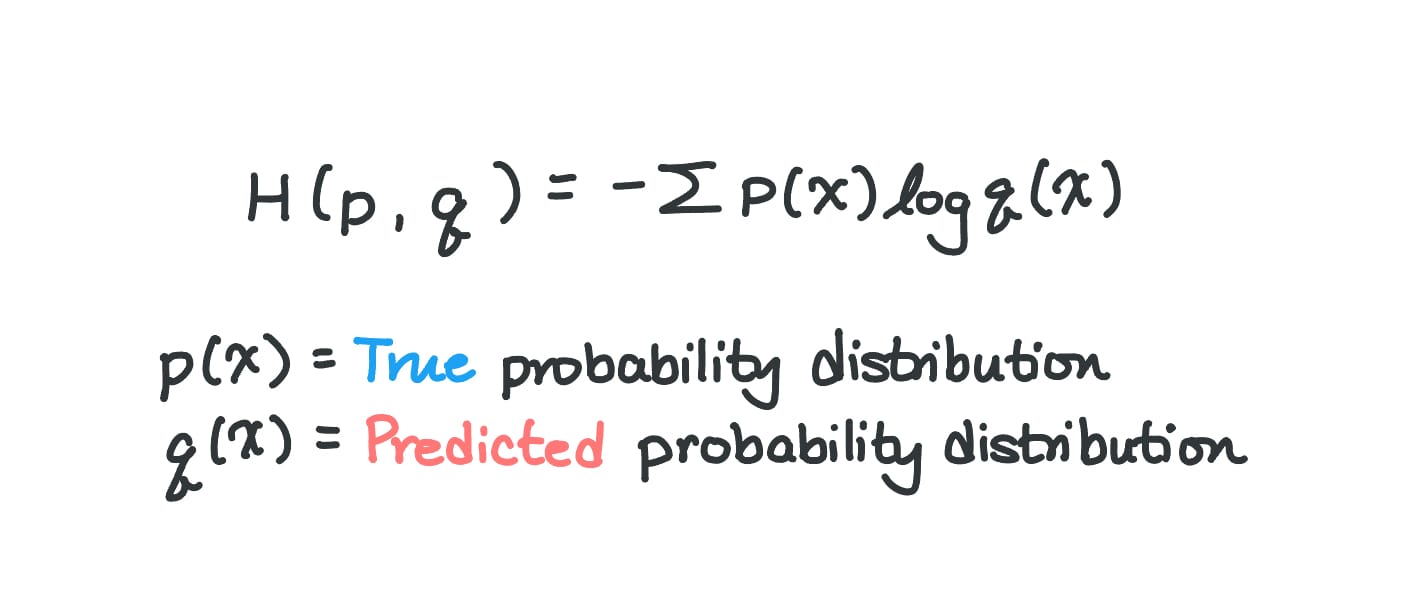
Of course, the log is a natural log (log base e).
Using the above equation, I'll go over 3 cases to show how the cross-entropy value changes with varying "surprise levels."
Case 1: Confident Correct Prediction
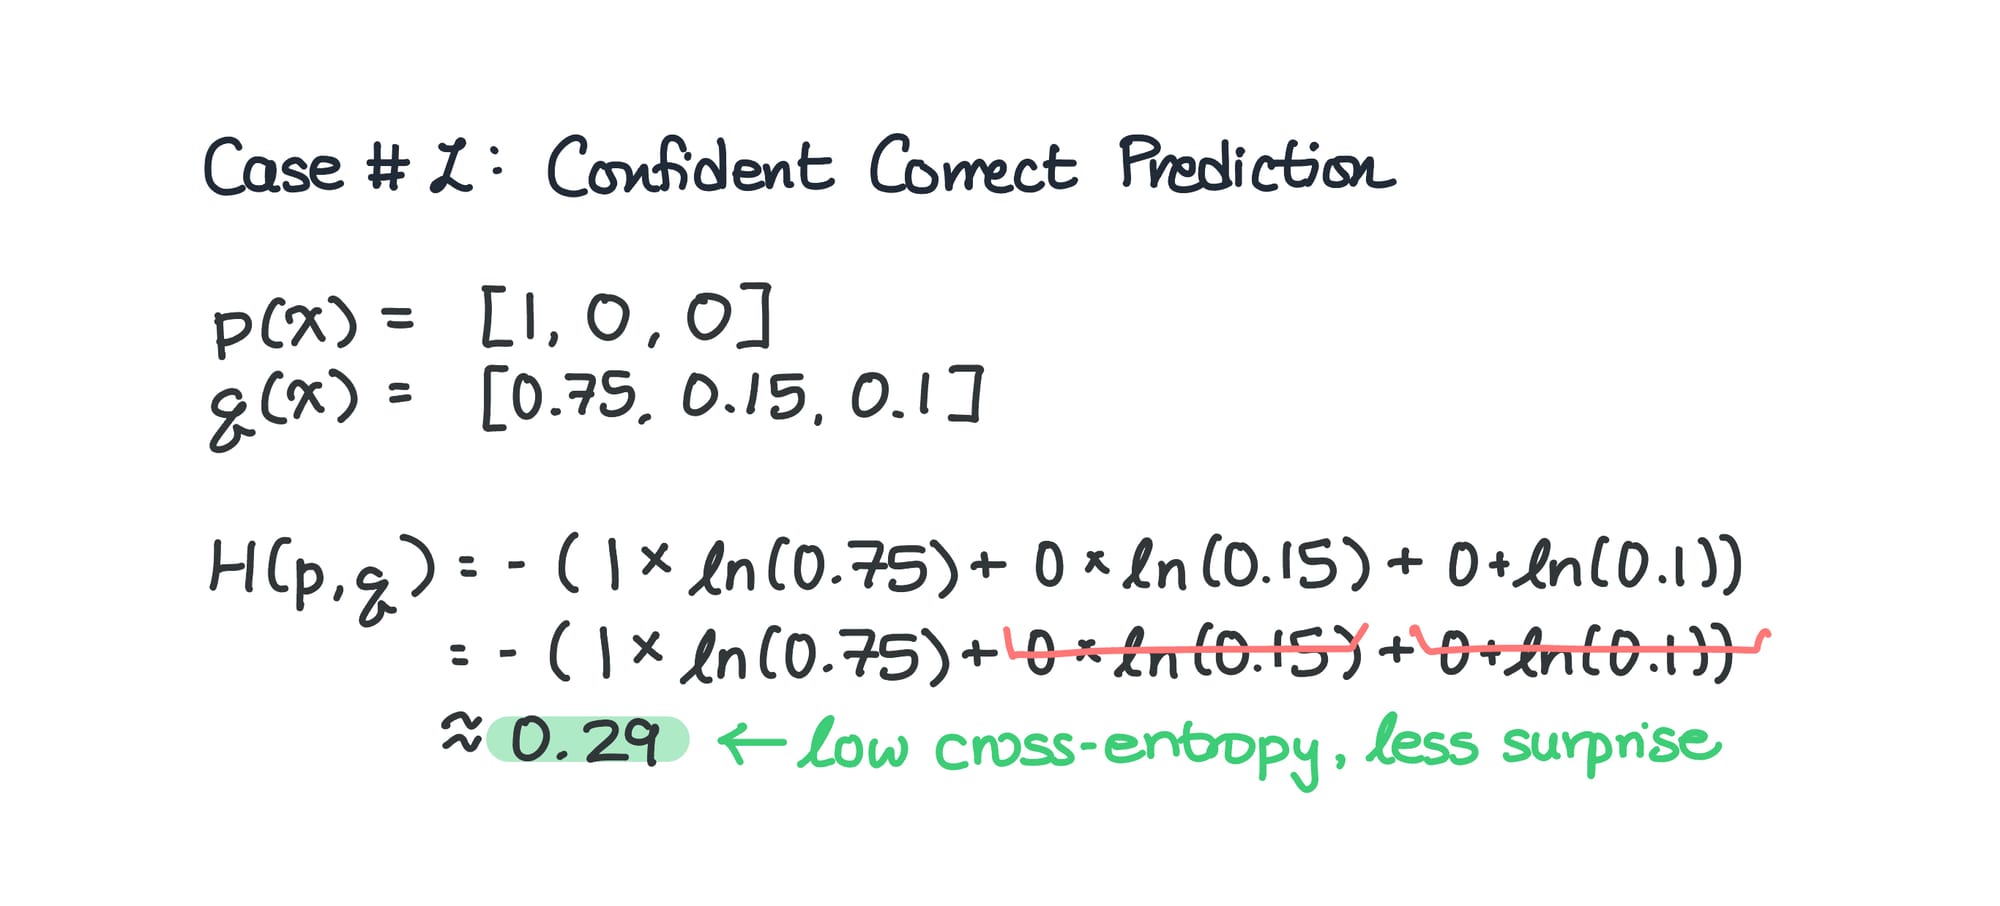
This is the case of the probability distribution where the model predicts:
- 75% chance of the image being a cat
- 15% chance of the image being a bear
- 10% chance of the image being a lion
Since it places the highest percentage chance on the correct answer, the cross-entropy value will be low since there isn't much surprise when you confidently predict the correct outcome, and you're actually correct.
Case 2: Uncertain Prediction
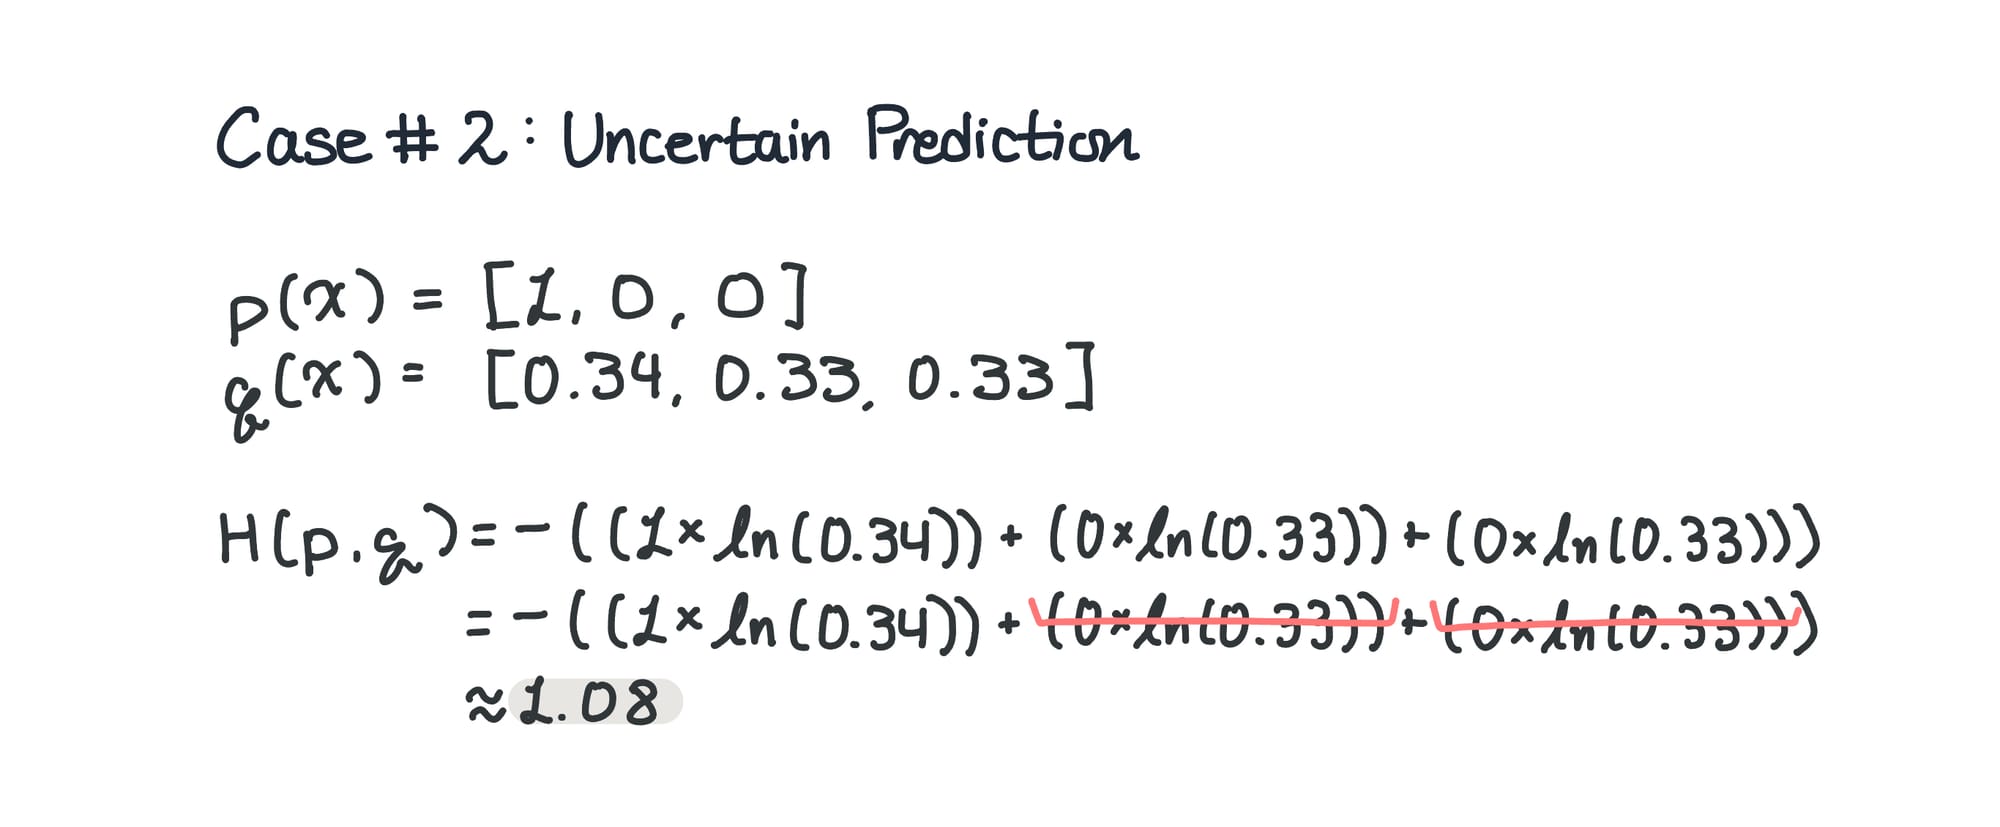
In case of an uncertain prediction, the cross-entropy value is going to be greater than the value in the first scenario.
In the example above, I have probabilities that mirror something similar to a random guess – 1/3 bet on each option. Because the model isn't as "confident" with its predictions, there is a little more surprise when the predictions are compared to the actual labels.
Case 3: Confident Wrong Prediction
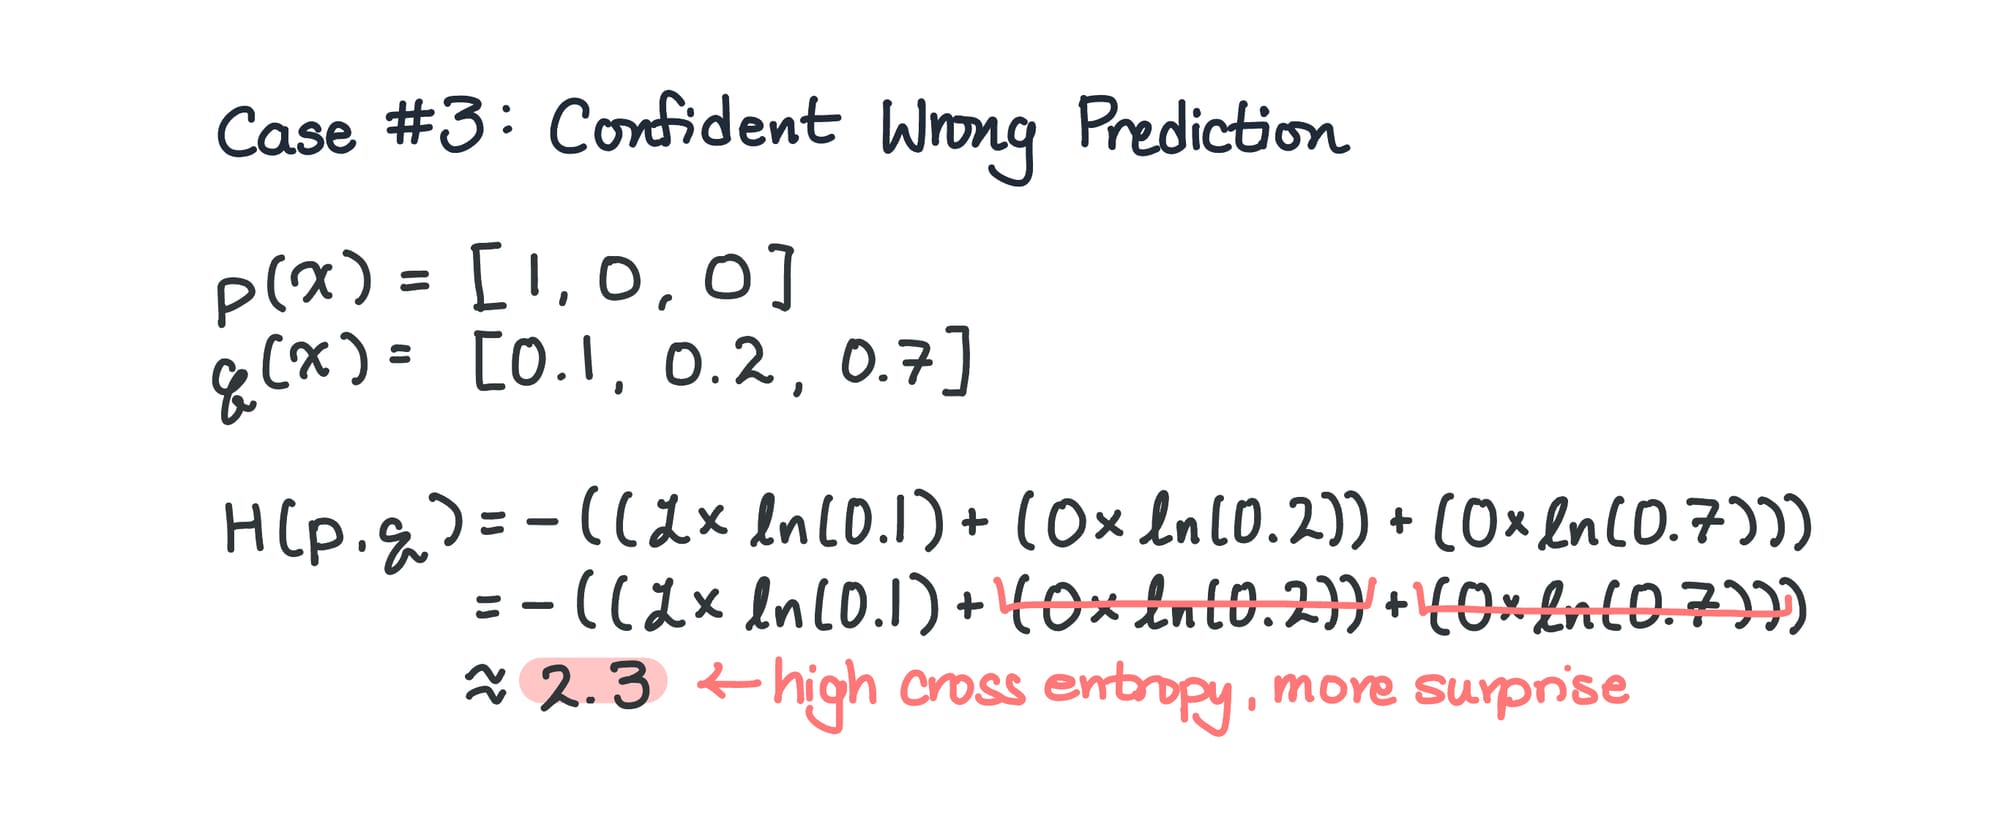
In this last example, we can see that the model's predictions are a lot more off than what we saw in case #1 – the model thinks there is the highest chance of the image being a lion (70%) and the lowest chance of the image being a cat (10%) – the actual label.
In this case, we can say the model is "confidently wrong," because it's assigning a large probability to the wrong answer. It's like when you just know you chose the correct answer, only to find out later that you were completely wrong, leading to "more surprise."
The bottom line of cross-entropy is that it comes from the idea of entropy (the uncertainty or surprise in a distribution), and it’s called cross-entropy because it measures the surprise of the model's prediction against the true labels.
Closing
When I was first planning this post, I didn't realize I would hit an almost-2000 word-count. Therefore, I plan to write up another post on the handful of other jargon I want to clarify. I was probably right about this becoming its own series lol 😆
Anyway...
I'm still on my learning journey with all this, so if you find anything inaccurate, please let me know -- I'd really appreciate it.
...And thanks if you make it this far!
Until the next post of this series,
Ael